Inside the workstation, not beside it
Not a chat in another window: it sits next to the chart, sees your panels and works on the data in front of you.
One workstation, with a chatbot that builds strategies, indicators and backtests with you. Six plugins extend it, and automated trading has a section of its own.
In the browser, nothing to install. Born on crypto, built for any market that produces a tick.
Diagram of the workstation: the symbol bar on top, the tool column on the left, in the centre a candlestick chart with bubbles for the large trades and the volume profile along the right edge, below it the band of net flow per bar. On the right three panels: book and depth, agents, computation engine. At the bottom the status bar with the window, the step and the seed of the series.
Diagram of the workstation — not a screenshot of the product
It lives inside the workstation: describe a strategy or an indicator in words, and it writes the code, charts it and backtests it. The code stays yours.
Not a chat in another window: it sits next to the chart, sees your panels and works on the data in front of you.
Strategies, indicators and tools described in words become code you can read, change and run again.
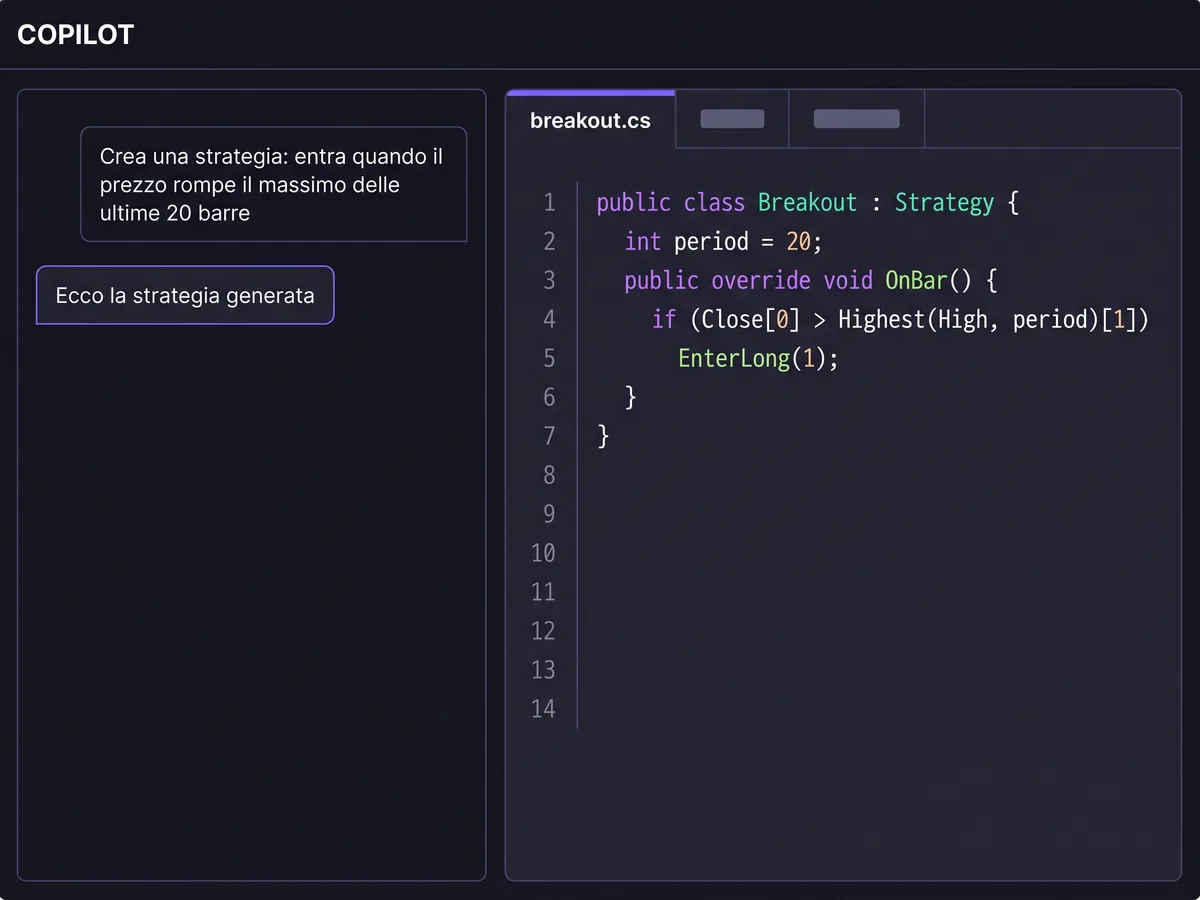
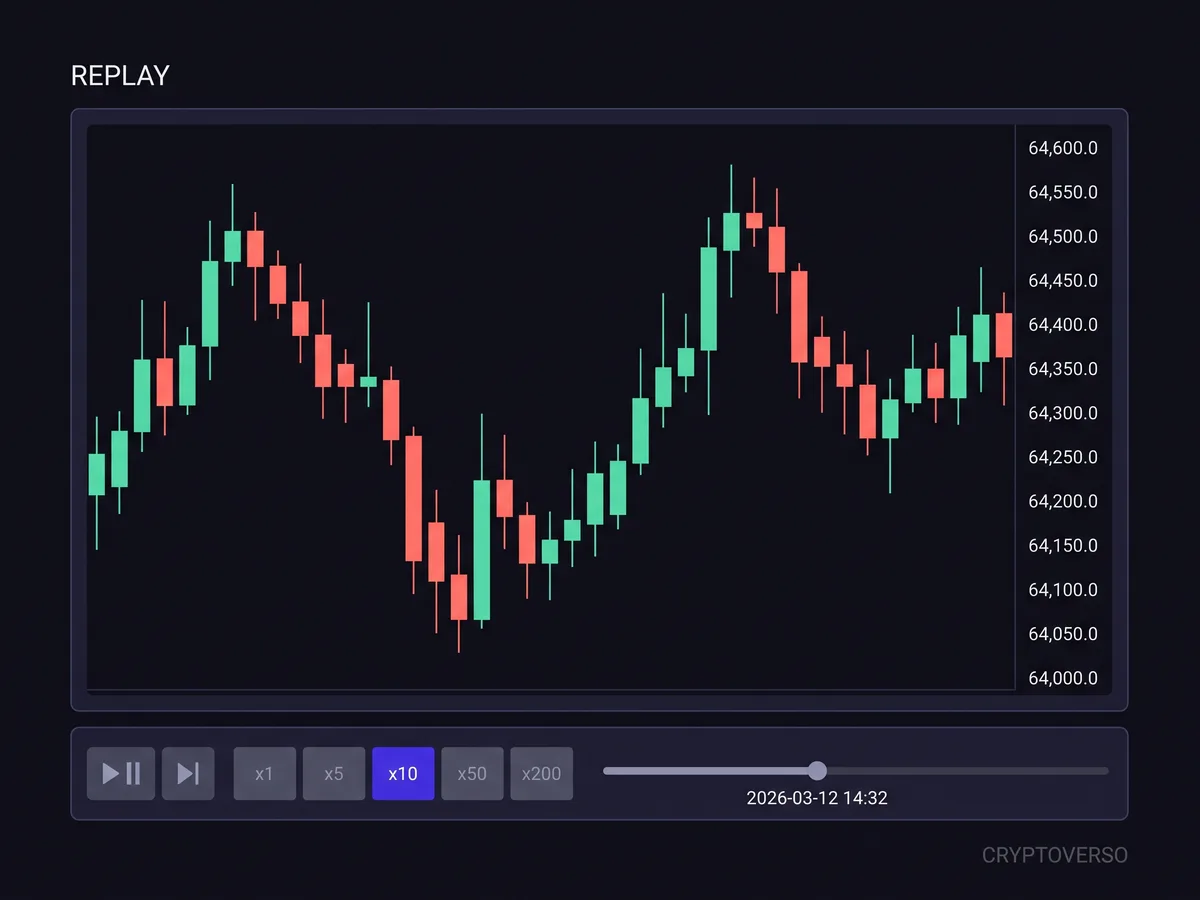
What it writes goes straight to a backtest, bar by bar, with window, step and seed declared.
Ask what is happening on a symbol: the answer carries the measurements behind it, and can be reproduced.
Filters and rankings across hundreds of symbols, including ones you build by asking in words.
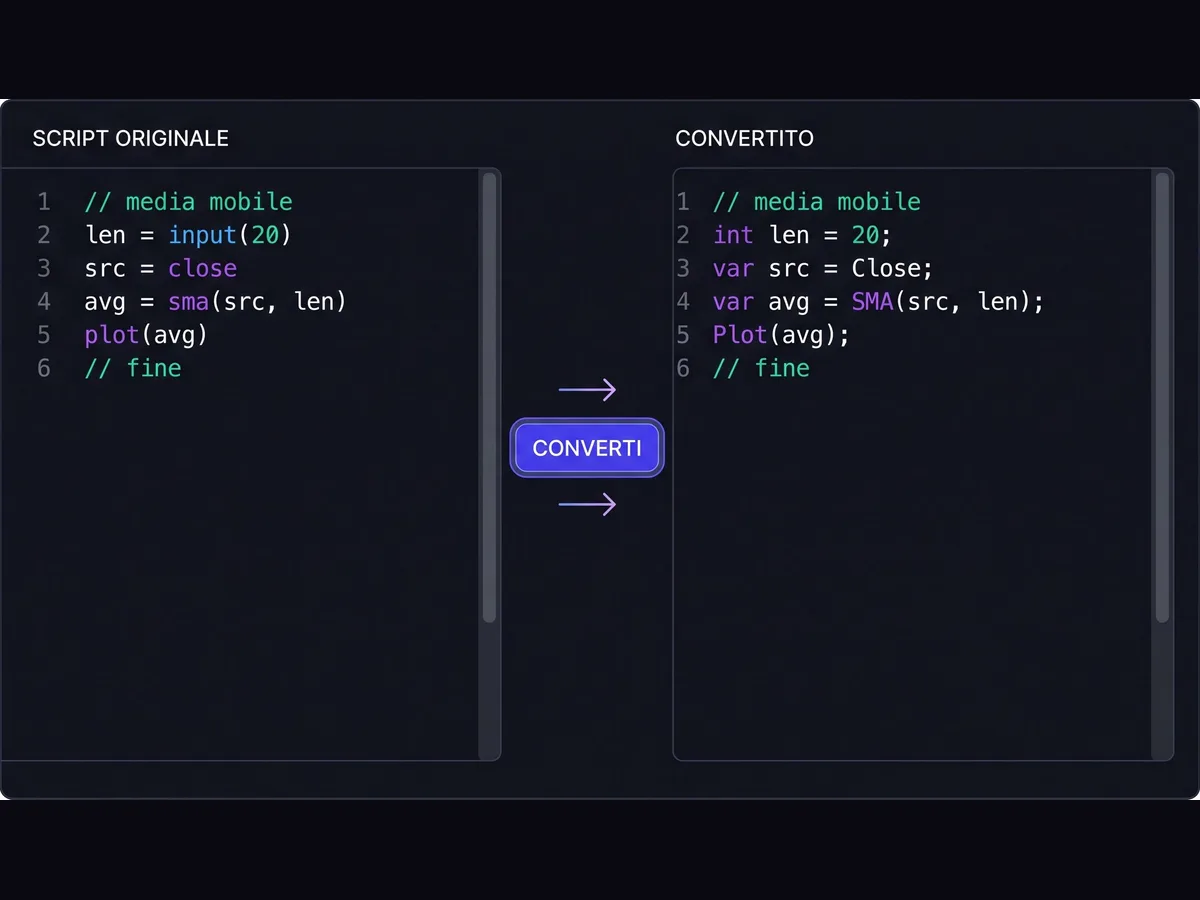
The scripts you already have on TradingView come along; TradeStation and MultiCharts are phases on the roadmap.
Local models are included and run on hardware of ours: no meter. For external providers you add your own key and pay them, with no markup.
Features land one by one: the pre-sale funds the next ones.
Each one is research already done: methods put to the test and dropped when they did not hold. They are enabled separately, on top of the base.
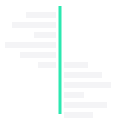
The volume traded at every price. You decide.
Small diagram of volume by price level: horizontal bars of different length stacked along the price axis, crossed by the price line.
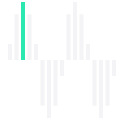
Buying and selling at each bar price. You decide.
Small diagram of trading inside the bar: for each bar two columns of cells side by side, one per side, with the fullest cell highlighted.
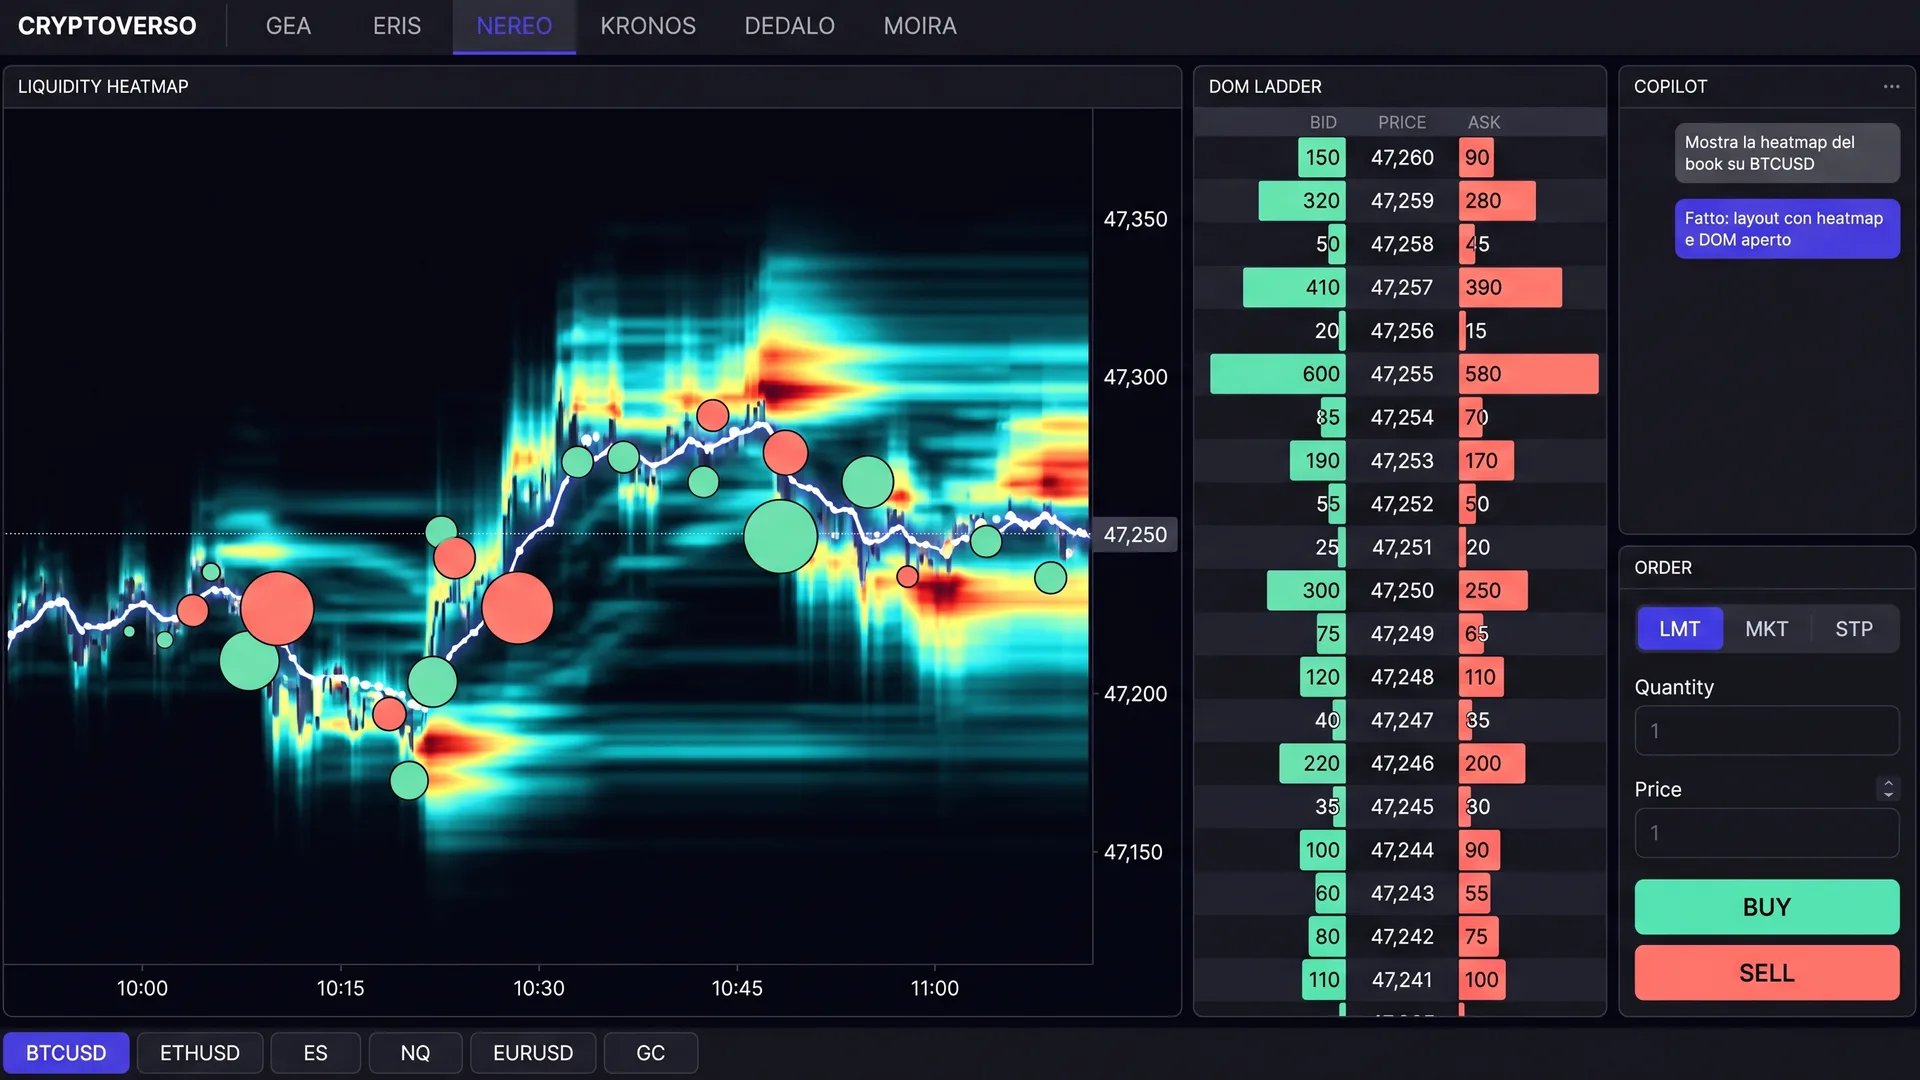
Waiting liquidity and large trades, where they happen.
Small diagram of resting liquidity: a heat map of cells, four bubbles of different size for the large trades, and the price line crossing them.
Length, phase and validity of every cycle, in time.
Small diagram of cycle overlap: four waves of different period and amplitude drawn one over the other on the same axis.
Systems as versioned modules, with optimisation when you need it.
Positioning read from the options flow. A measurement, never an instruction.
The figures on the cards are declared diagrams: real screenshots arrive when the platform opens.
Execution on your own venue, with your own API keys. Funds stay on your exchange: we never hold them. The AI proposes and measures; you authorise.
They read the market and write their reasoning in the clear. You decide how much autonomy they get, and no strategy goes live on its own.
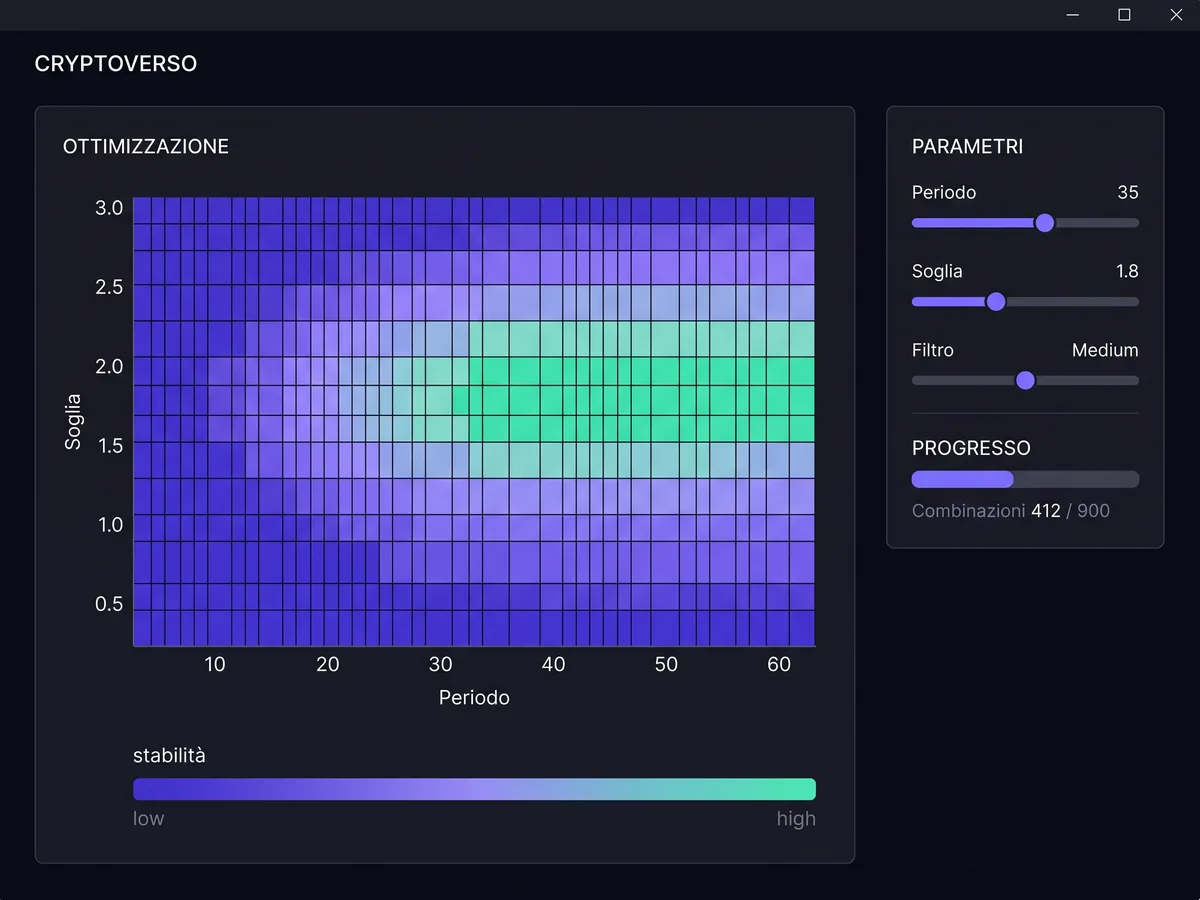
Maximum position, maximum loss per strategy and per portfolio, VaR, order frequency, cooldown after an event. You write them, and the engine measures them.
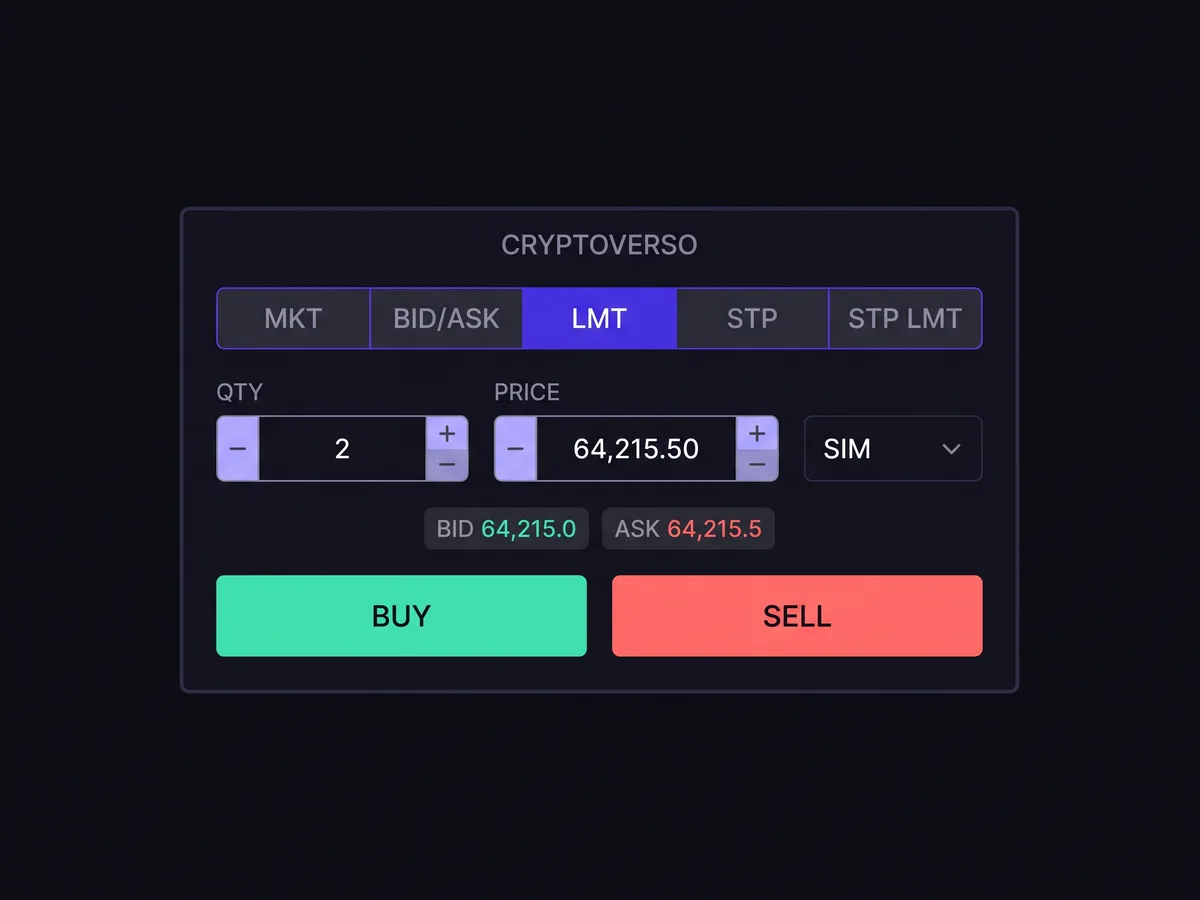
Every strategy has a version, a status and a history. Hyperparameters are declared, and the future is never granted.
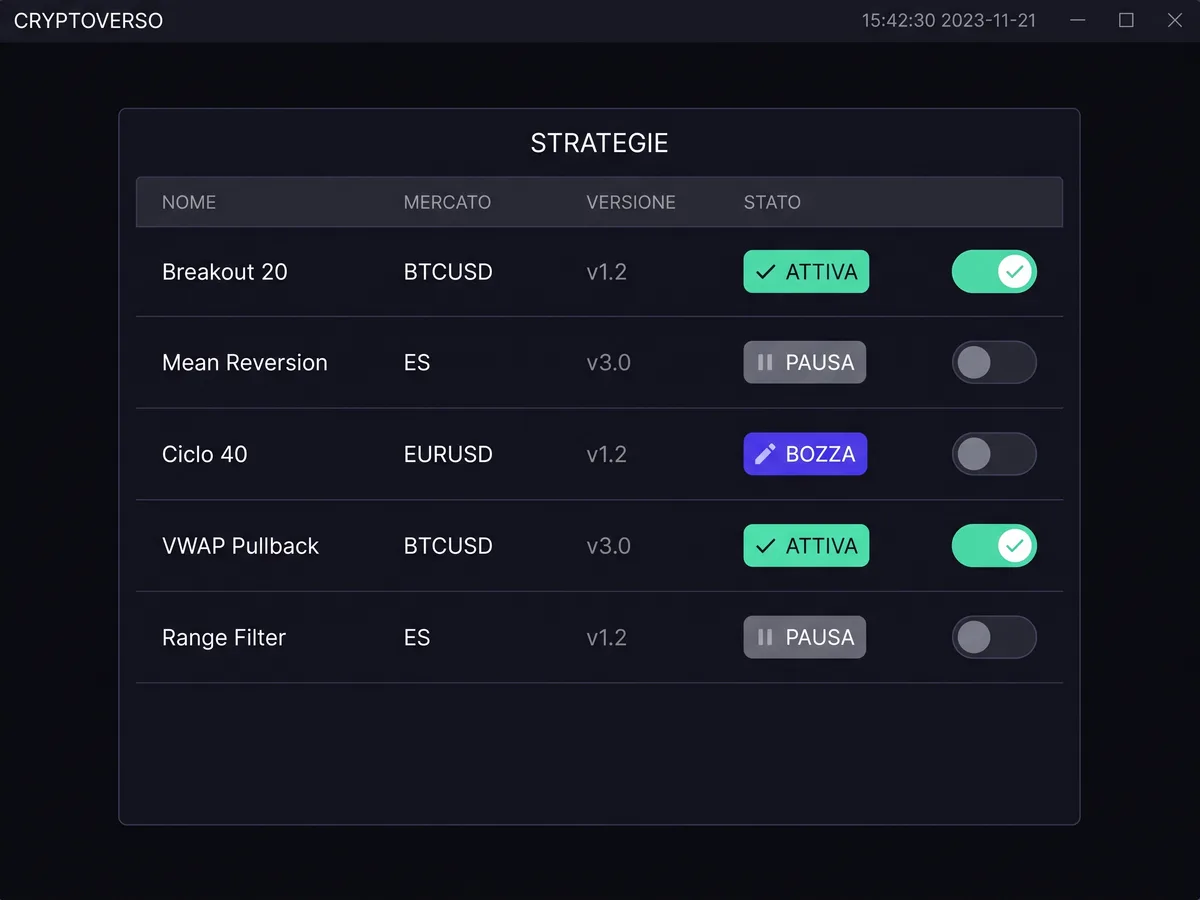
Dedicated sub-accounts on your own broker, each with its own strategies and limits. Not there yet: it is a declared direction.
Deterministic rules before and after. What the model proposes goes through a statistical gate declared in advance, and what fails is written down with the reason.
Funds stay on your exchange: we never hold or move them. You authorise, and you can revoke.
Five label-and-value rows describing one pass of the chain: inbound rules passed, three hypotheses raised by the model, only one of them through the statistical gate, one module left as a candidate, and automatic promotion declared as not provided.
The discarded hypotheses stay in the ledger, with the reason for the discard.
Diagram of the control chain — not a screenshot of the product
The procedure is not on display. It lives in the volumes of the series, in the live courses and in the papers, and each one is paid for.
Volumes that carry the method in full, with runnable notebooks that redo the sums page by page.
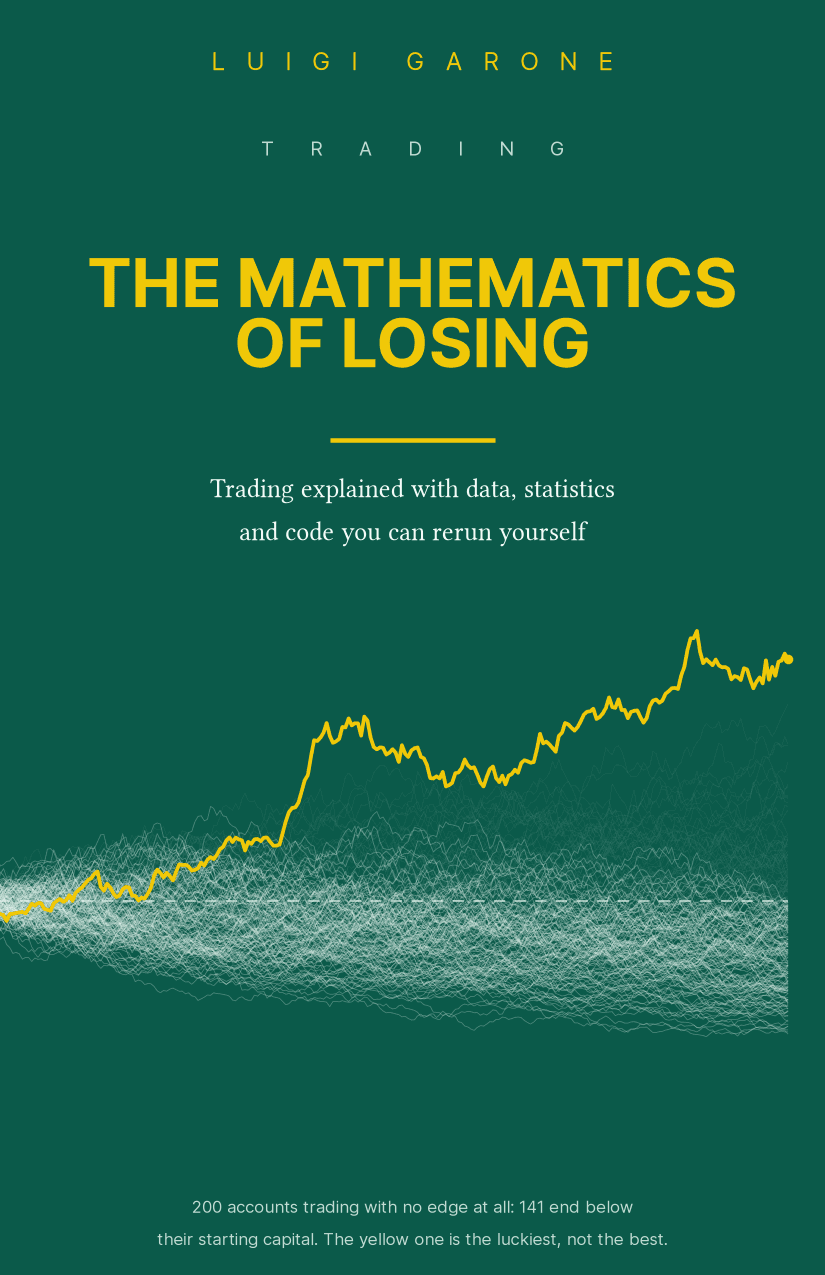
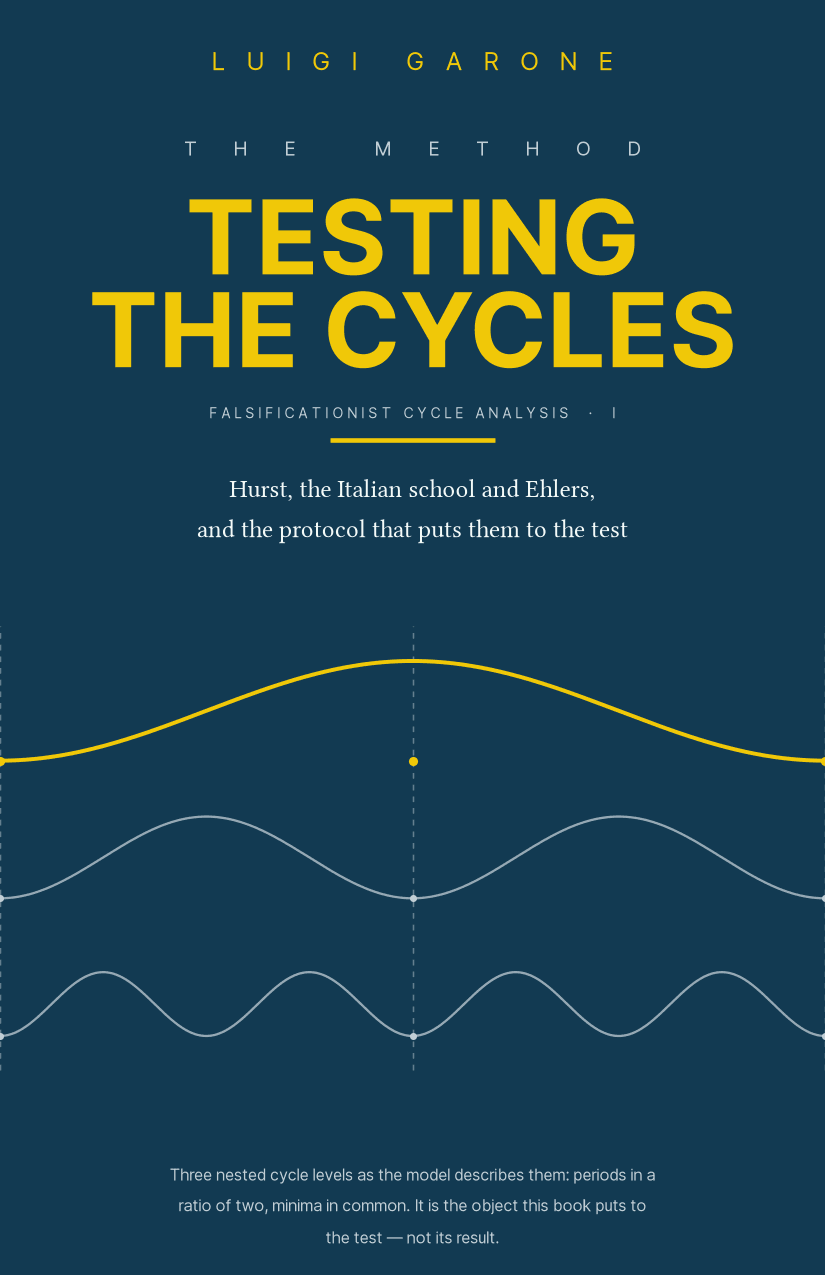
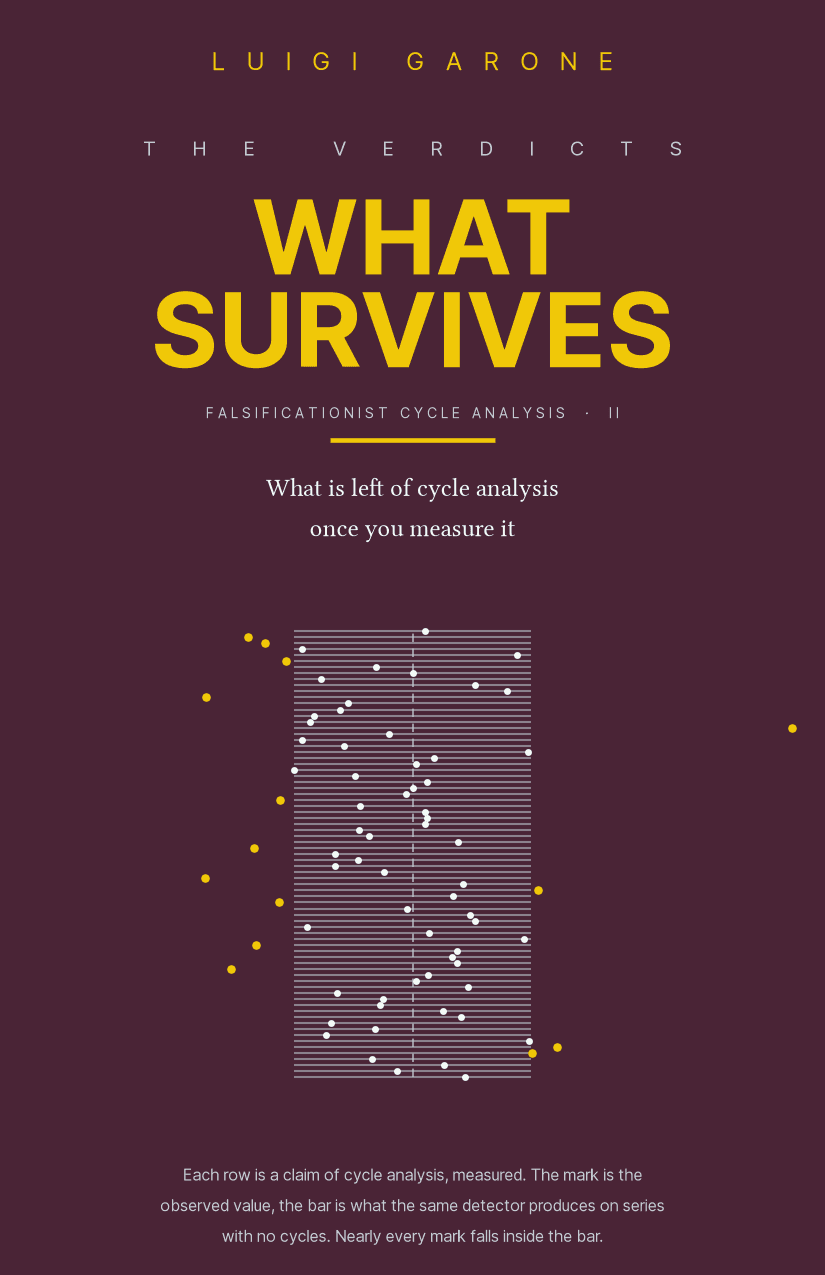
Lessons on how to measure, and on how to tell when the measurement no longer holds.
Papers with method, data and replication code. Abstract, DOI and BibTeX stay public; the full text is paid for.
The platform opens with an account, in the browser. Meanwhile the pre-sale is open, and the book labs stay free.
The six modules